
We’re continuing our page speed series with some measuring tools in this post. I’m going to give you some clues on what to look for in these tools and when to start worrying about your stats.
But first let’s have some fun. We’re going to start with the obvious one:
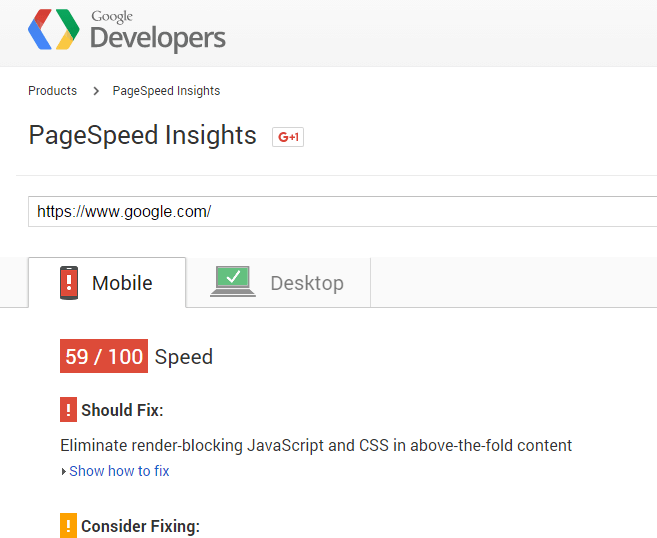
Google Pagespeed Insights
If you heard about page speed, it’s likely that this was the first site that you’ve tested your website and you’re disappointed with your results. You felt cheated by your web designer and since your mobile score is much lower than your desktop score, you thought that your website isn’t mobile friendly. Then you started looking for ways to improve your website’s page speed score and you stumbled upon this post. So lucky. Unfortunately, many people will see this post after they already spent lots of money for hiring freelancers to develop that score or spent a lot of time following useless tutorials which are obsessed about getting a 100. And you probably failed at that infamous “Eliminate render-blocking JavaScript and CSS in above-the-fold content” comment. It was in your nightmares, I know it. Because I had those too.
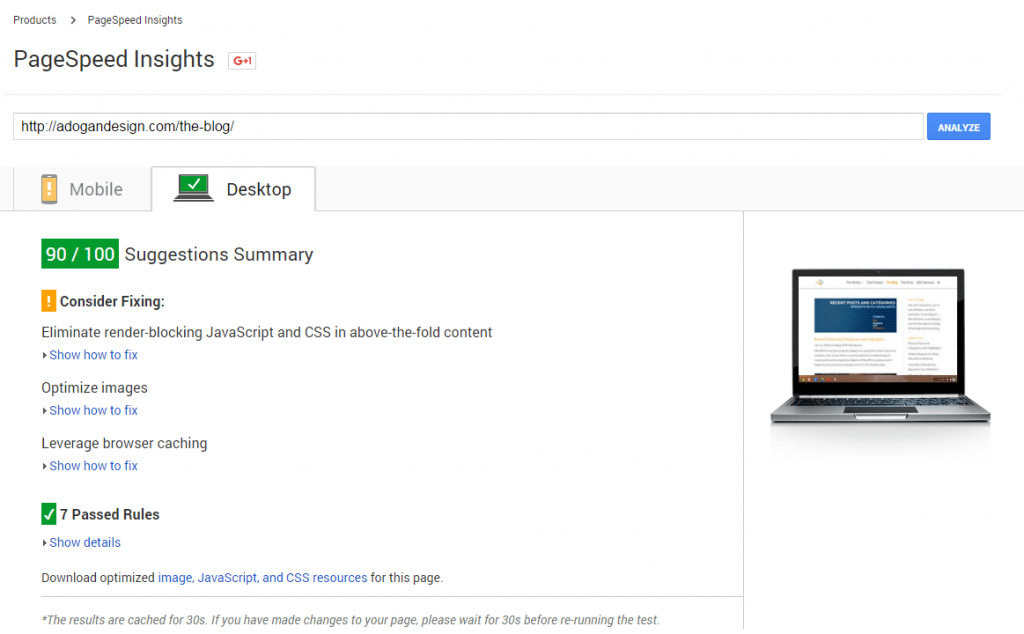
Of course, I can’t trash google that easily. This PageSpeed tool is useful but as the name suggests it only gives insights and it’s not a total, comprehensive tool. I’m going to prove it at the end of this article but for now, let’s just say that it’s missing the most important metric and keep going with my favorite tool GTmetrix.
GTMetrix
This page speed tool is awesome. It has a clean, easy to understand report structure and when you sign-up for free, it allows you to track the download speed of 3 of your pages daily.
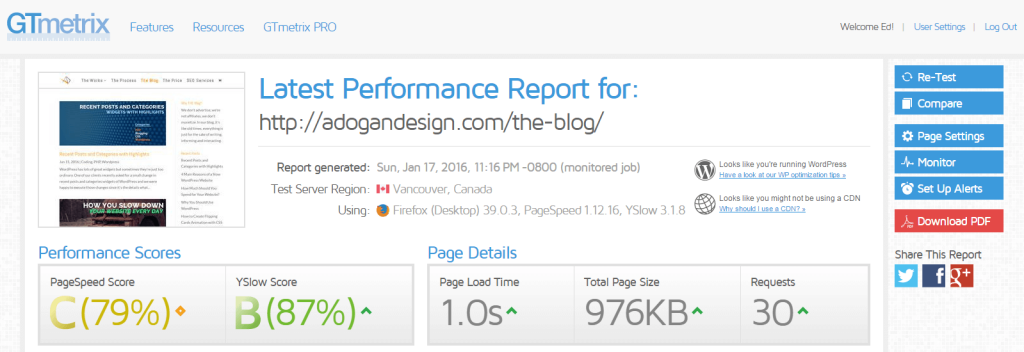
Pro Tip: First, look at the page load time.
As you can see, the design of the report card gives you the most important data immediately. And the first one you should look at, in this report card, is the page load time. If you see anything below 2s, then you don’t need to worry about this issue at all because you’re not going to lose visitors if your page loads under 2s. As you can see in my report card, my blog page loads in 1s from Vancouver so I don’t worry about improving my PageSpeed and YSlow scores.
If you sign-up for GTMetrix you can repeat these tests from different locations. I’m targeting US market mostly and my servers are in Dallas. So, Vancouver location gives me a pretty good idea about the speed of my website for my target audience. You should adjust the location according to your needs.
If it’s above 2s, you should keep analyzing your website. Just below your main scorecard, you’ll see 5 tabs. PageSpeed, YSlow, Waterfall, Video and History. Pagespeed and YSlow tabs are going to give you insights on how to solve your problems. The third tab, Waterfall is also a really useful one which can direct you to the exact problem if you know what you’re looking at. In my other post about page speed and hosting, I’ve mentioned a problem you can solve with this analysis.
Other than hosting problems, waterfall also can show you the bottlenecks and the files that cause problems on your page.
Pingdom
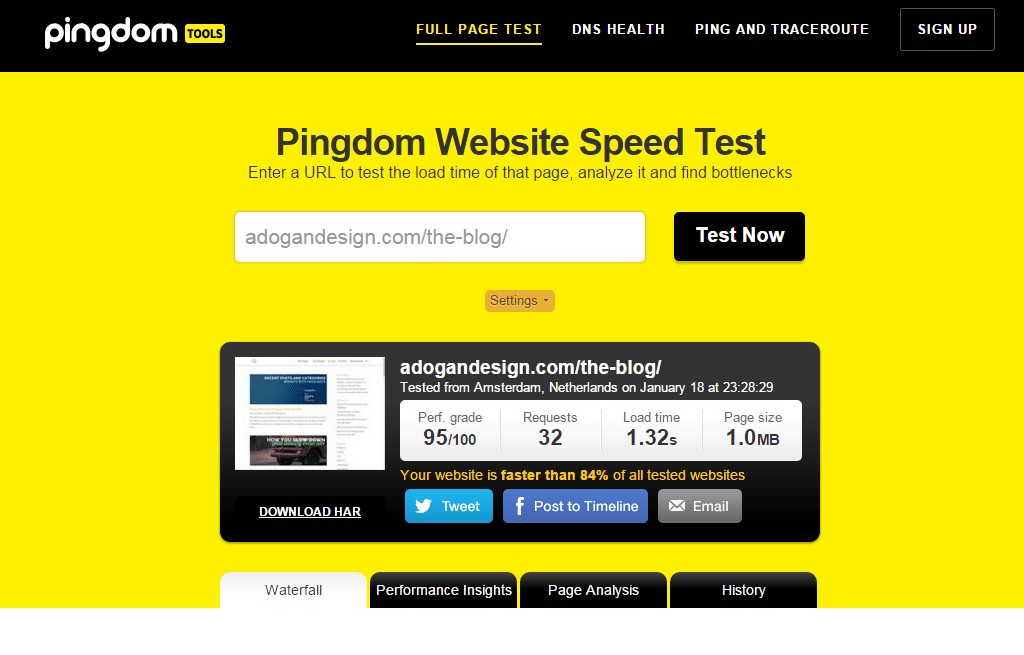
The next page speed tool that I’m going to introduce is my backup plan. It gives similar information to GTMetrix. You can switch locations of your test, it has waterfall analysis tool and gives performance tips etc. To be honest, I prefer GTMetrix because the interface looks more professional. Otherwise, the information you get is pretty much the same. So I just use this one to confirm my results.
WebPageTest
This is another great tool that provides lots of information. The problem is it comes with a Windows 95 interface. So if you’re not in the business for the last 20 years, you may not appreciate this website.
On the other hand, it gives a critical information that the other tools ignore. It gives two results, one is for the first view (no caching) and the other one is the repeat view. If there’s a substantial difference between these times, you may want to make some improvements toward the first viewer, such as inlining the above-the-fold content.
DotCom-Tools
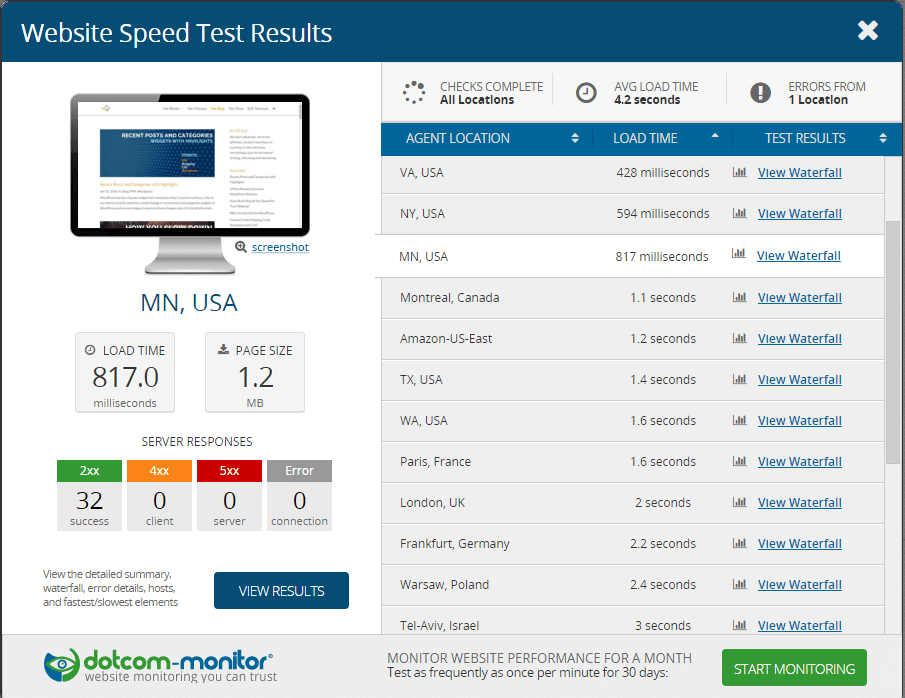
The last tool I’m going to mention is the dotcom-tools. If you’re targeting a global audience, you should use this one. Why? Because it gives you the results from 23 different locations directly. For instance, my results are great for the US, but probably I won’t be able to make any business with China with 15s download time (It may be a glitch, hopefully).
Google Page Speed Insights Revisited
After seeing the other ones, you’ve probably understood why I was negative about Google’s PageSpeed Insights at the beginning. It doesn’t have the first thing that we all need to look at:
Page Load Time.
And also I’m very doubtful about their suggestions after seeing this
Maybe they should start listening to some of their own suggestions.
Easter Egg: If you’re curious I suggest you to try this same test on the other tools I’ve mentioned here and decide which one is the best yourself. Go ahead and check gtmetrix.com’s speed at gtmetrix.com